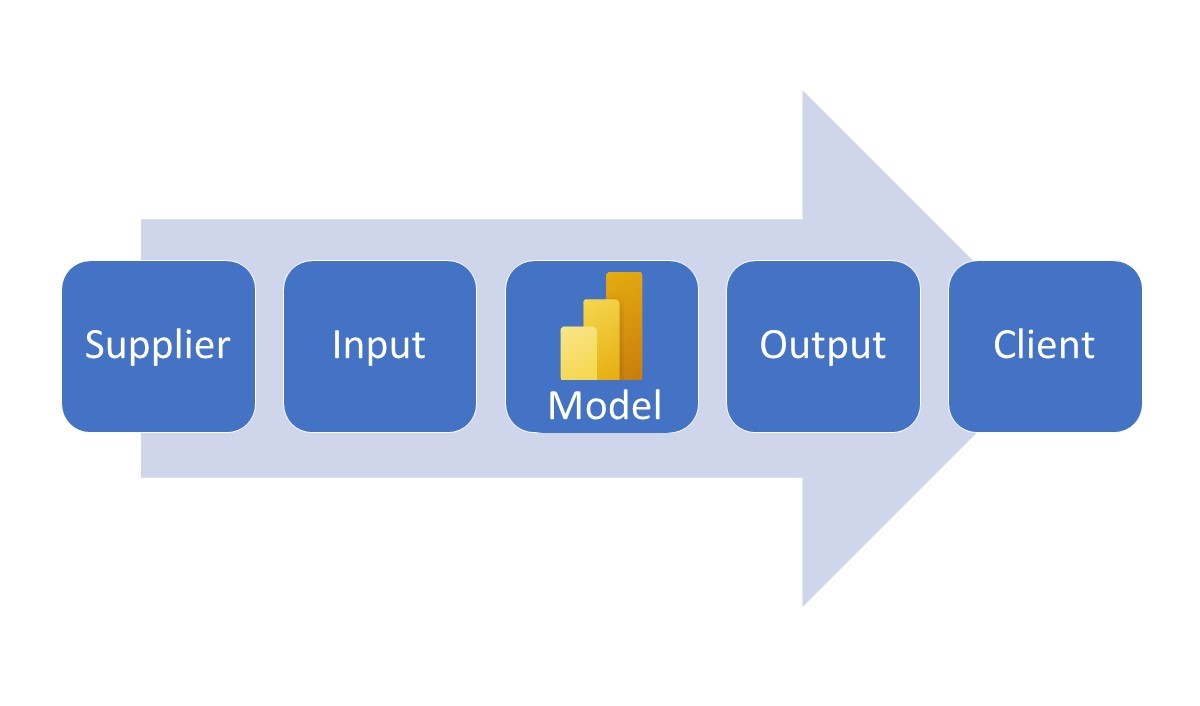
Before you start building a new Power BI model, it is crucial to establish the context first. I have facilitated many Lean VSM (Value Stream Mapping) initiatives to make a process (more) lean. I learned the SIPOC (Supplier - Input - Process - Output - Client) approach as a Green Belt and adapted it to make it useful in designing the data flow in and out of a BI model. So before you open a blank BI model and start entering data, go to a big white-board, get some markers and start designing your model using the SIMOC approach.
This is a creative process that begins with determining who will be the Customer of the model. This phase also determines the Customer's goal: what decisions are they going to base on the management information provided by the model
Then determine the Output that best fits that purpose. Actually start laying out the graphics on your whiteboard. Don't confuse trying to understand your customers' information needs with asking them what visuals they would like to see and how you can put them on a canvas. Remember Henry Ford's quote: If I had asked my customers what they wanted, they would have answered "faster horses." Visualizing data in Power BI is an art that requires knowledge and experience with the almost endless possibilities Power BI offers.
The next step is to determine the Input required to create the dashboard. Power BI offers a wide range of ETL (Extract, Transform & Load) functionality to shape, clean up and mash your data, so don't worry too much about data not coming in a nice, clean structure.
Then set your data providers fixed. If they are existing vendors, sit down with them and make them aware that you are building a Power BI model and therefore automating the process. This requires good collaboration between you and your customer, as Power BI will often completely change the current process. Typically, a manual process involving exporting and importing CSV or XLS files will be replaced by an interface between the source system and the Power BI model.
Last but not least, design your model. Before you start building, draw the kind of model you will develop on your whiteboard. Often you will manage a model with a Fact table in the middle, surrounded by Dimension tables. But this can also be reversed, where a Dimension table bridges multiple Fact tables. Also, a header - detail model might be the best fit for your scenario.
Certainly do not turn a SIMOC into a formal process where the output is documented and possibly audited. A SIMOC only serves to structure the modeller's thought process during the design phase. It is also highly recommended that you do the SIMOC with your customer and suppliers to improve communication and understanding. After all, if you have decided to build a Power BI model, you have decided to try to realize the potential that Power BI offers in creating a much more efficient and robust data flow in your organization.