In the world of DAX formulas, the two formulas that get mixed up the most are FILTER and CALCULATETABLE. This is due to the fact that they actually produce the same result in certain scenarios. For example, when a Matrix is created on the canvas in which a filter is applied to one dimension table (in this case by adding it to the rows of this Matrix) and the filter in the DAX formula is applied to another dimension table.
Consider these two formulas:
1.1 Count Sales Product A FILTER =
COUNTROWS (
FILTER (
fact_Sales,
RELATED ( dim_Products[Productkey] ) =. "Product A"
)
)
1.2 Count Sales Product A CALCULATETABLE =
COUNTROWS (
CALCULATETABLE (
fact_Sales,
dim_Products[Productkey] = "Product A"
)
)
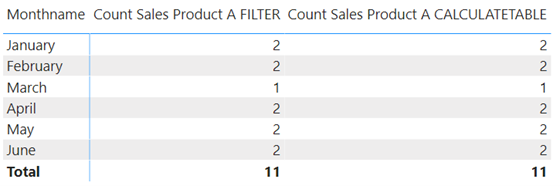
The syntax is actually similar, and so are the results when applied in this Matrix:
However, the engine evaluated these two formulas differently. 1.1 is executed in a nested row context (provided by the FILTER formula) within a filter context (provided by the measure).
However, 1.2 is executed within a modified filter context because the filter in the CALCULATETABLE statement is added to the initial filter context which is filled only by the month name coming from the row header. If you are not sure about row and filter context, be sure to watch my videos on these concepts.
Now let's see when FILTER and CALCULATETABLE begin to diverge.
Consider these formulas:
2.1 Count Sales March FILTER =
COUNTROWS (
FILTER (
fact_Sales,
RELATED ( 'Calendar'[Monthname] ) = "March" &&
RELATED ('Calendar'[Month] ) = 3
)
)
2.2 Count Sales March CALCULATETABLE =
COUNTROWS (
CALCULATETABLE (
fact_Sales,
'Calendar'[Monthname] = "March",
'Calendar'[Month] = 3
)
)
2.1 simply filters the sales table to only March, so if a filter from the row header falls on another month, a filter is applied to that other month and to March, resulting in a blank result.
2.2 on the other hand overwrites the month name coming from the row header in the filter context, so it will always return the value for March, regardless of the value in the row header.
And now let's look at a more profound difference between the two. Again, look at these formulas:
3.1 Count Sales Previous Month FILTER =
COUNTROWS (
FILTER (
fact_Sales,
PREVIOUSMONTH ( 'Calendar'[Date] )
)
)
3.2 Count Sales Previous Month CALCULATETABLE =
COUNTROWS (
CALCULATETABLE (
fact_Sales,
PREVIOUSMONTH ( 'Calendar'[Date] )
)
)
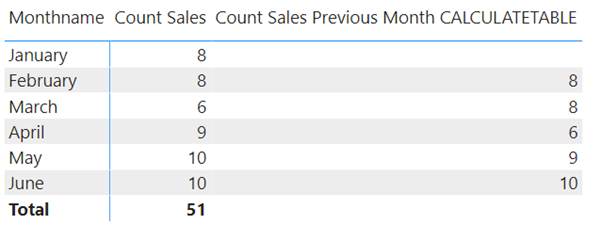
Since CALCULATETABLE is used in 3.2, the initial filter context can be overwritten by what is specified in the filter statement, i.e., PREVIOUSMONTH ( 'Calendar'[Date] ). In this formula, DAX causes the month name in the initial filter context to be overwritten by the month before it.
FILTER is unable of overwriting the initial filter context so trying that would give an error.
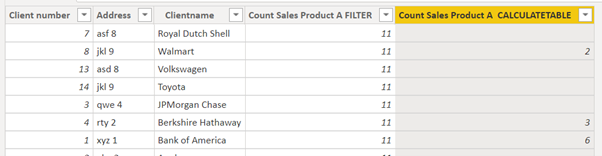
The last, but certainly not the least difference is the fact that CALCULATETABLE, like CALCULATE, causes a context transition. So, if a formula is initially evaluated within row context, that row context will be converted to a filter context. To show this behavior, calculated columns work well because the evaluation context of a calculated column is row context. Consider these 2 columns that we will add to the dimension Clients table:
4.1 Column Count Sales Product A FILTER =
COUNTROWS (
FILTER (
fact_Sales,
RELATED ( dim_Products[Productkey] ) =. "Product A"
)
)
4.2 Column Count Sales Product A CALCULATETABLE =
COUNTROWS (
CALCULATETABLE (
fact_Sales,
dim_Products[Productkey] = "Product A"
)
)
4.1 will not perform any context transition, the evaluation context remains row context. Row context does not filter. I repeat: row context does not filter. So we just get back a count of all Product A sales, for all customers.
4.2, however, will perform the context transition. So first a filter is applied to the customer in the data model and then the evaluation of the formula is done. Therefore, this will result in the count of product A per customer.
Do you want to become a Power BI Pro? Minova offers Power BI in-company training for all levels, from beginner to advanced. Check out the training page for more information