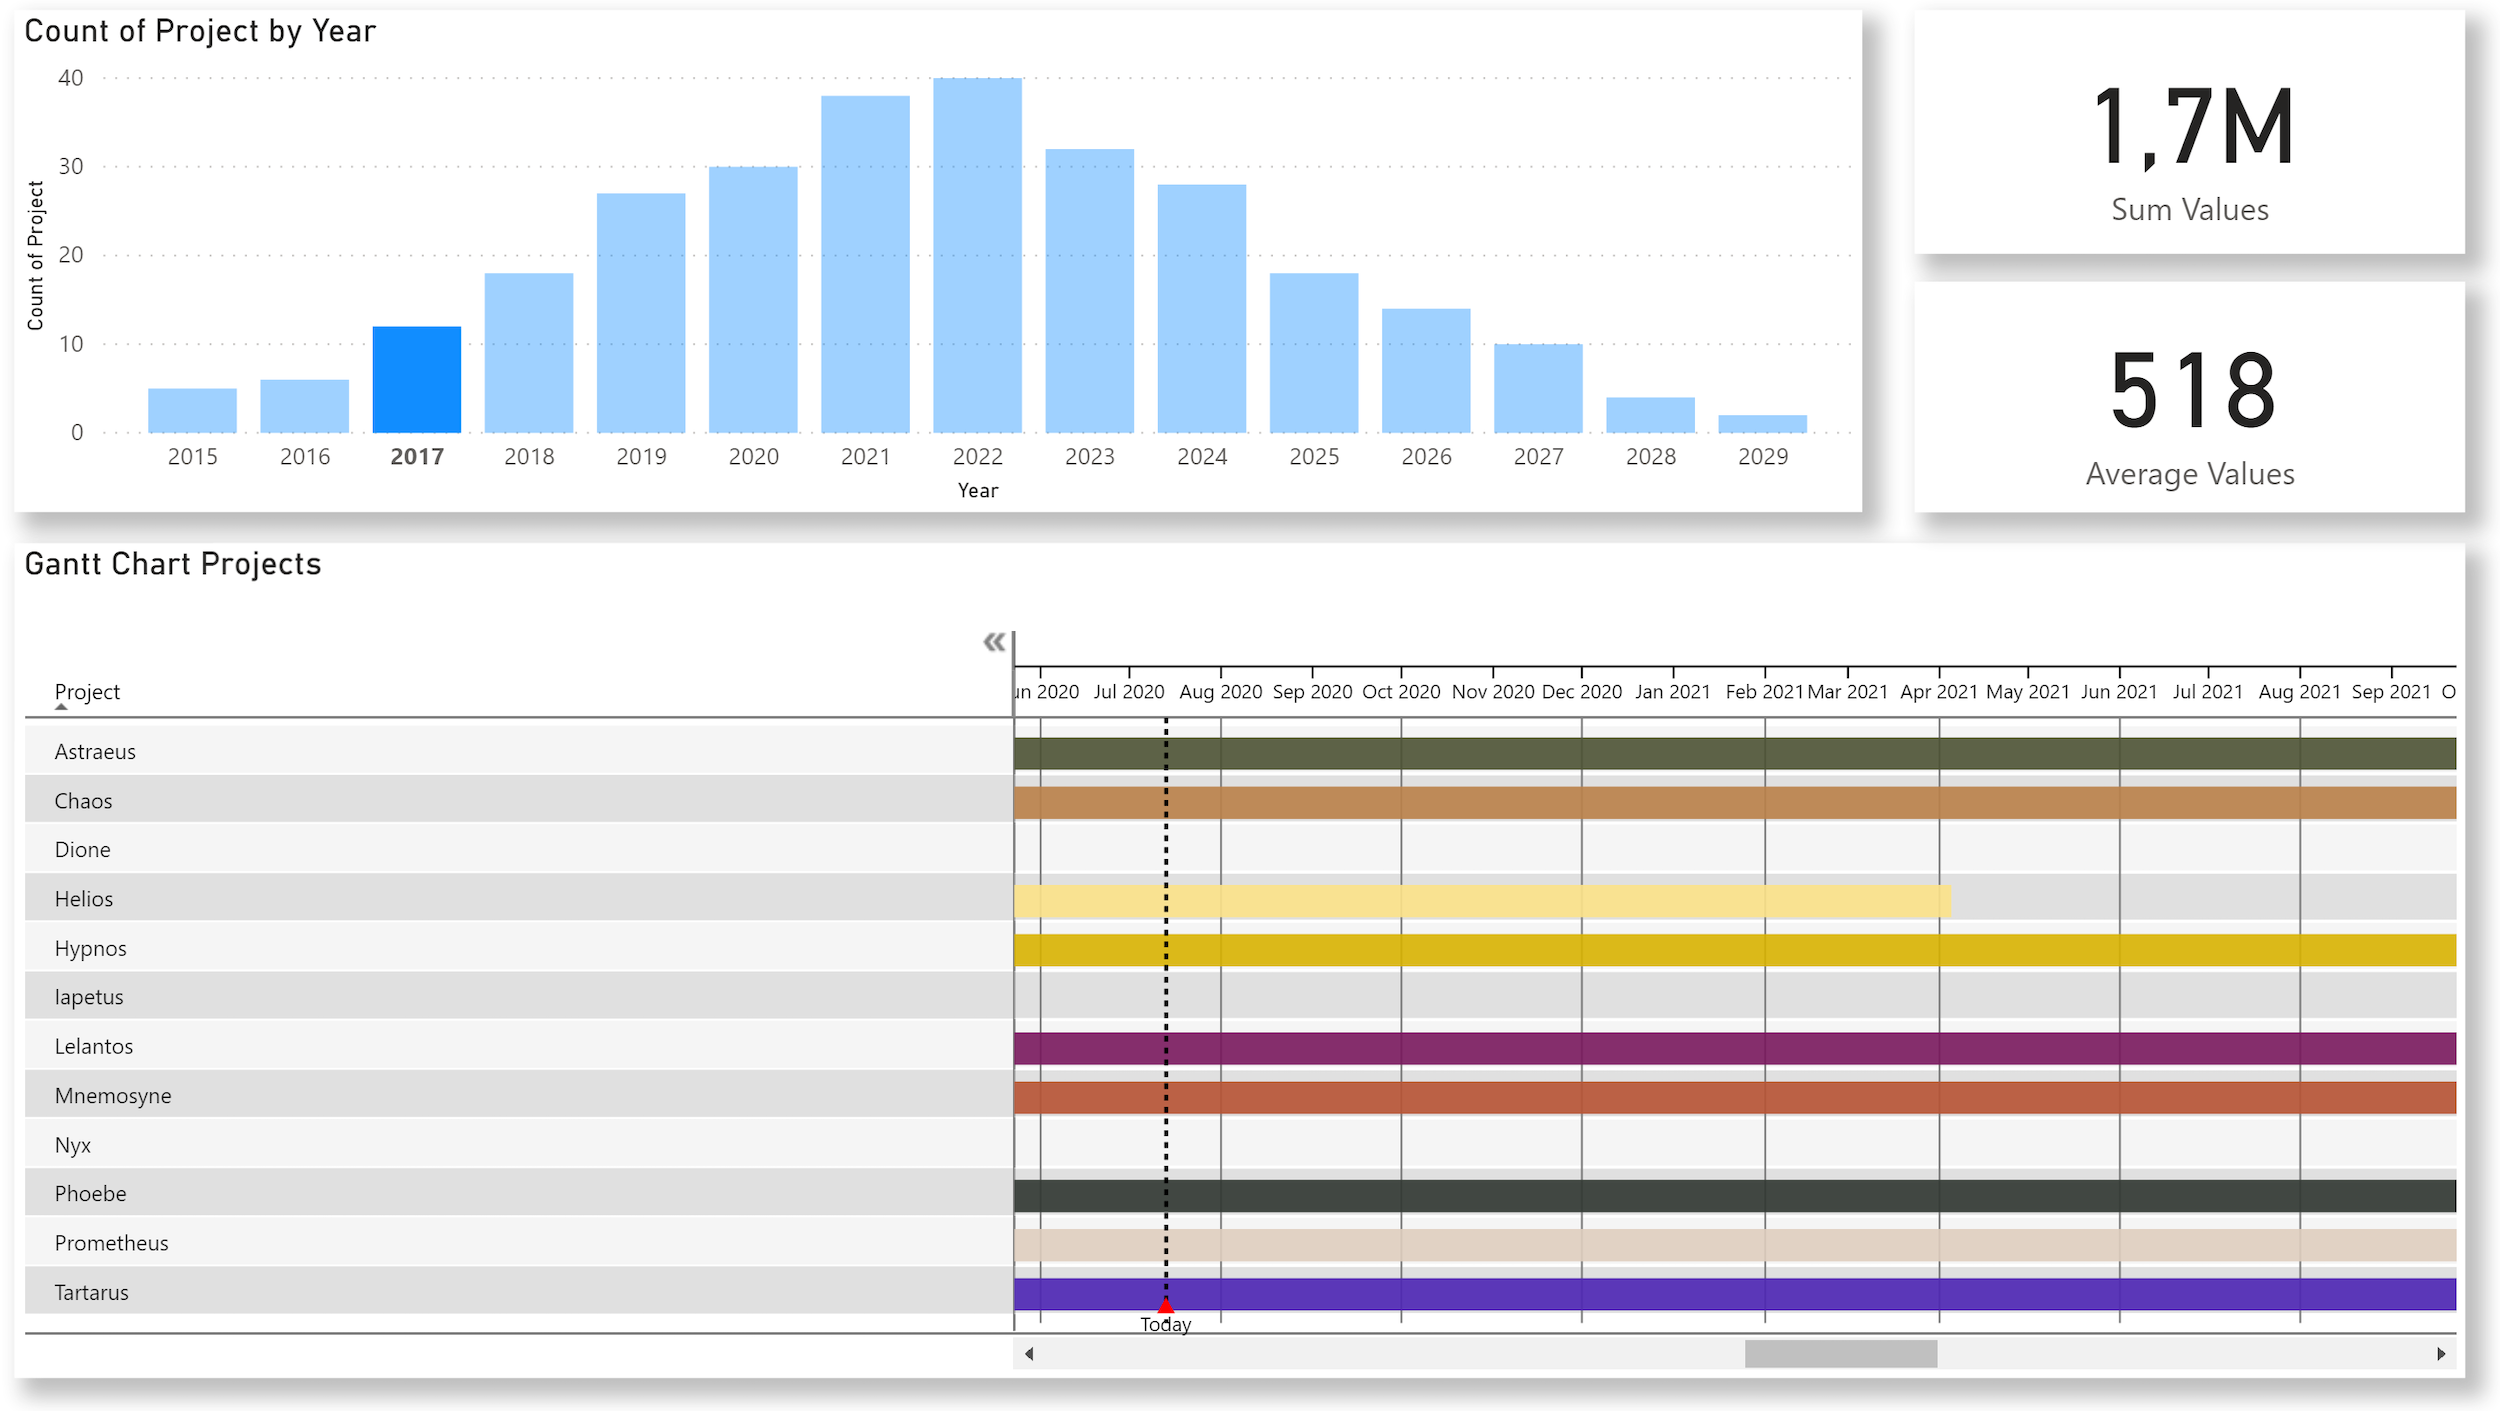
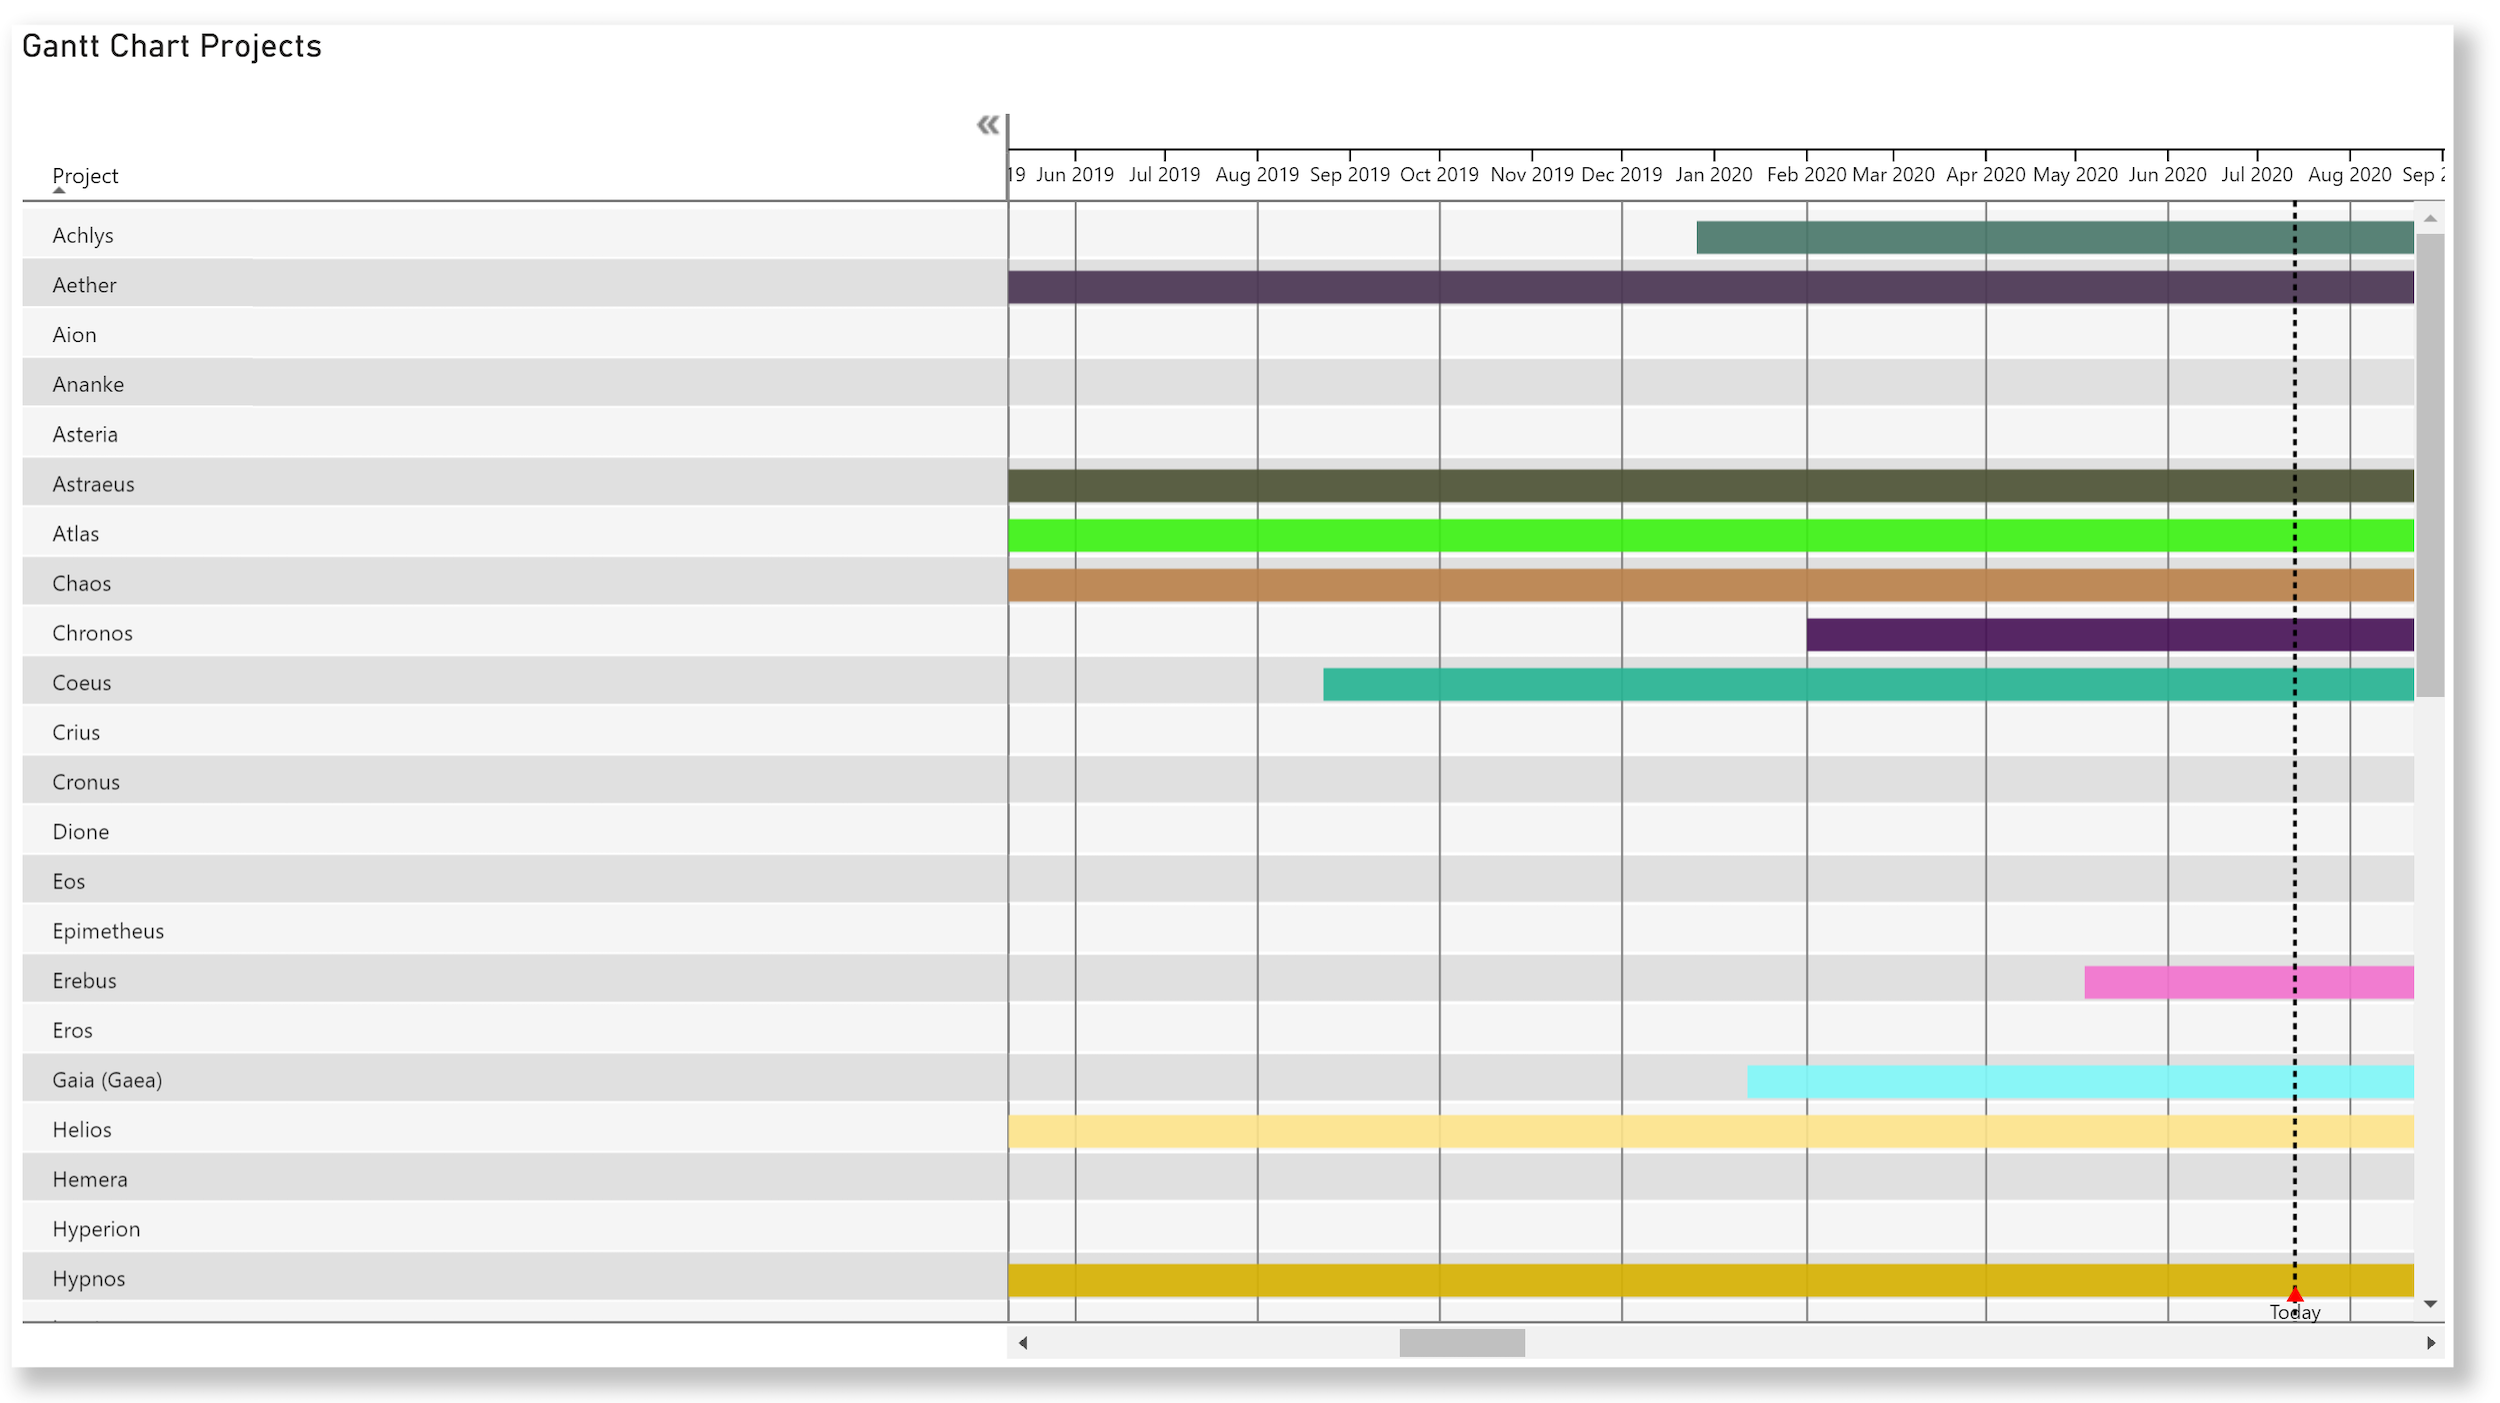
If you manage your projects in Power BI, I can highly recommend the Gantt chart from MAQ software. You can download it for free and it is very easy to use. All you have to do is enter the name of your projects, the start date and the end date and you are ready to go. Additional features are also available, but not required. This could be an overview of your projects.
However, if you have many projects running, you will want to add a visual that shows how many projects are running at any given time. This requires some DAX: You need an additional table that, for each day, keeps track of which projects are in progress. That table can be based on the projects table. The latter is simply a table of your projects with start and end dates as columns.
In this scenario, you would need to cross-link your date table and your projects table. However, you should be able to modify the date table, ensuring that you only get rows back from your date table for dates that a project is running. Enter GENERATE. This is a DAX formula that allows exactly that; the second table (the projects table) is the result of evaluation in the context of the first table (your date table).
I've also added a value to this data, which can be anything you'd like to capture: the number of FTEs needed for a project, the expected RoI, whatever...
After the second table is created, the dashboard above can be created. This shows the number of projects running during a year and allows you to filter the other visuals on the canvas, or drill down to the months and then to an individual date.