To make the right decisions you need insight. And so you will need to do data analysis to gain insight from data. But how does that work? Read all about it in this blog!
Data retrieval
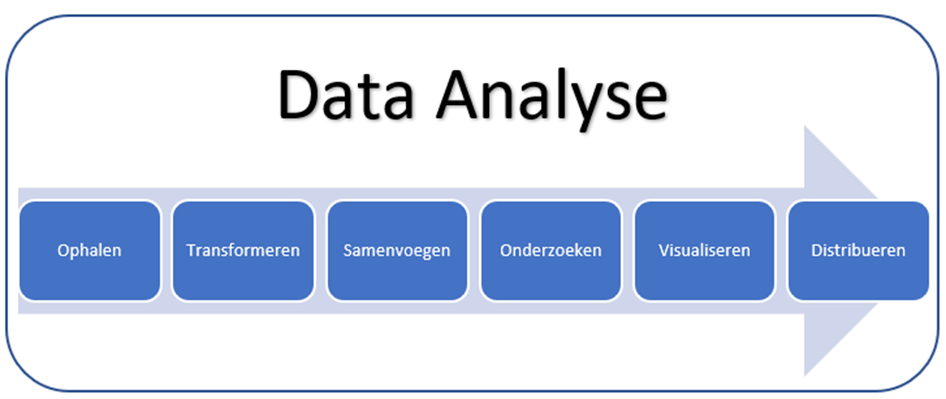
To be able to analyze data, it will first have to be retrieved somewhere. This is the first phase of the process which is often abbreviated to ETL: Extract, Transform and Load. That amounts to retrieving data, wherever it lives, and then transforming and loading it. More about the latter 2 in a moment.
Organizations have data in many different locations. Think databases, data warehouses, websites, files (mostly but not only Excel and CSV files), sharepoint lists, accounting packages and more. You want to make sure you connect directly to those sources so you don't have to deal with manual work every time you want to incorporate new data into your reports.
Transforming data
It would be nice if data were always available in a neatly arranged form, exactly as you need it. But in practice that never really happens. So we come to the T of ETL, transforming, often called cleaning, before you can start analyzing it. Filtering out data you don't need, filling in missing values, splitting data or just adding it is all part of this. And much more of course!
Merging data
Very often you will find that a particular analysis requires data from different sources. For example, if your data is in multiple Excel files. Or you base an analysis on data from a database but also need some information from a CSV file. Or you retrieve data from Google Analytics and want to supplement that with data from your data warehouse. And so there are all kinds of other situations imaginable.
You will then create a direct connection to multiple sources in the first phase. But if you don't merge that data in some way to make it into one integrated data model, you won't have much use for it. That's why you'll be doing the preliminary work during the retrieval of your data. Or, technically speaking, subdivide your data into dimension and fact tables. Long story short; you make sure your dimension tables contain data about business entities. Think about your products, employees, customers, etc. And your fact tables contain numerical information about a process. For a sales process, think about the number of units sold per sales transaction or the selling price per unit of product sold.
Then comes the L of ETL; in loading the cleaned data. After loading the data, you will create relationships between the tables to ensure that everything will work together.
Data Searches
After completing the previous phase, you have prepared your data and can begin to explore your data, also called data exploration. This is the phase where you look for hidden insights in your data. What is the story behind the numbers? You will do this by looking at your data from all kinds of cross-sections. And by identifying all kinds of patterns in your data and focusing your analysis on them. But increasingly also by using AI (Artificial Intelligence). Developments in this area are moving very quickly and AI is already so advanced that you can't use it without a lot of help. rocket scientist You don't have to be a professional anymore to apply it. For example, you can have month-to-month differences analyzed or have it examine whether there are notable anomalies in your data and what causes them.
Visualizing information
During the previous phase, you converted data into information. The visualization phase is about providing insight into that information on a report. The ultimate goal of your report is a better (business) decision by the report user. So it is important to keep that in mind when creating the report. It is by far best to design a report without a computer first. Just use a whiteboard if you are designing with several people or simply pencil and paper if you are doing this alone.
In that design, you want to make sure that the most important information springs immediately to mind. This often means that report users can immediately see whether KPIs are in line with the objective. You show this at the top and make it stand out through size and color. With KPI's that lag behind on targets it must be as easy as possible to find out from the rest of the report why.
Distribute information
The distribution of your report can be done by simply mailing your file around. But that is not easy to view and, more importantly, you have no assurance that all users are looking at the same version and therefore the same figures. That's why you place a report in the cloud. There are also possibilities to work together with a team on multiple reports and make them available to report users in a very controlled way. You can also shield information within a report for certain users. For example to the manager of a sales team all sales information but to account managers presenting the same report but only with information from their own customers.
In conclusion
This process is not really a process with a beginning and an end, but more of a cycle. If a report is actually used in the unruly practice, there will always be follow-up requests from the report users. Key words here are "experience" and "progressive insight". But organizations (and their environment) are also constantly changing. So it will always be necessary to ensure that the report optimally meets the information needs of the users. All in all, data analysis is a comprehensive, dynamic and above all very interesting activity!
And those 6 steps? Those come from the Power BI "Dashboard in a Day" training, developed by Microsoft. And I also cover those steps extensively in my basic training. For more information, check out the training page on this website!